Sun Images from now - updated every 10 minutes
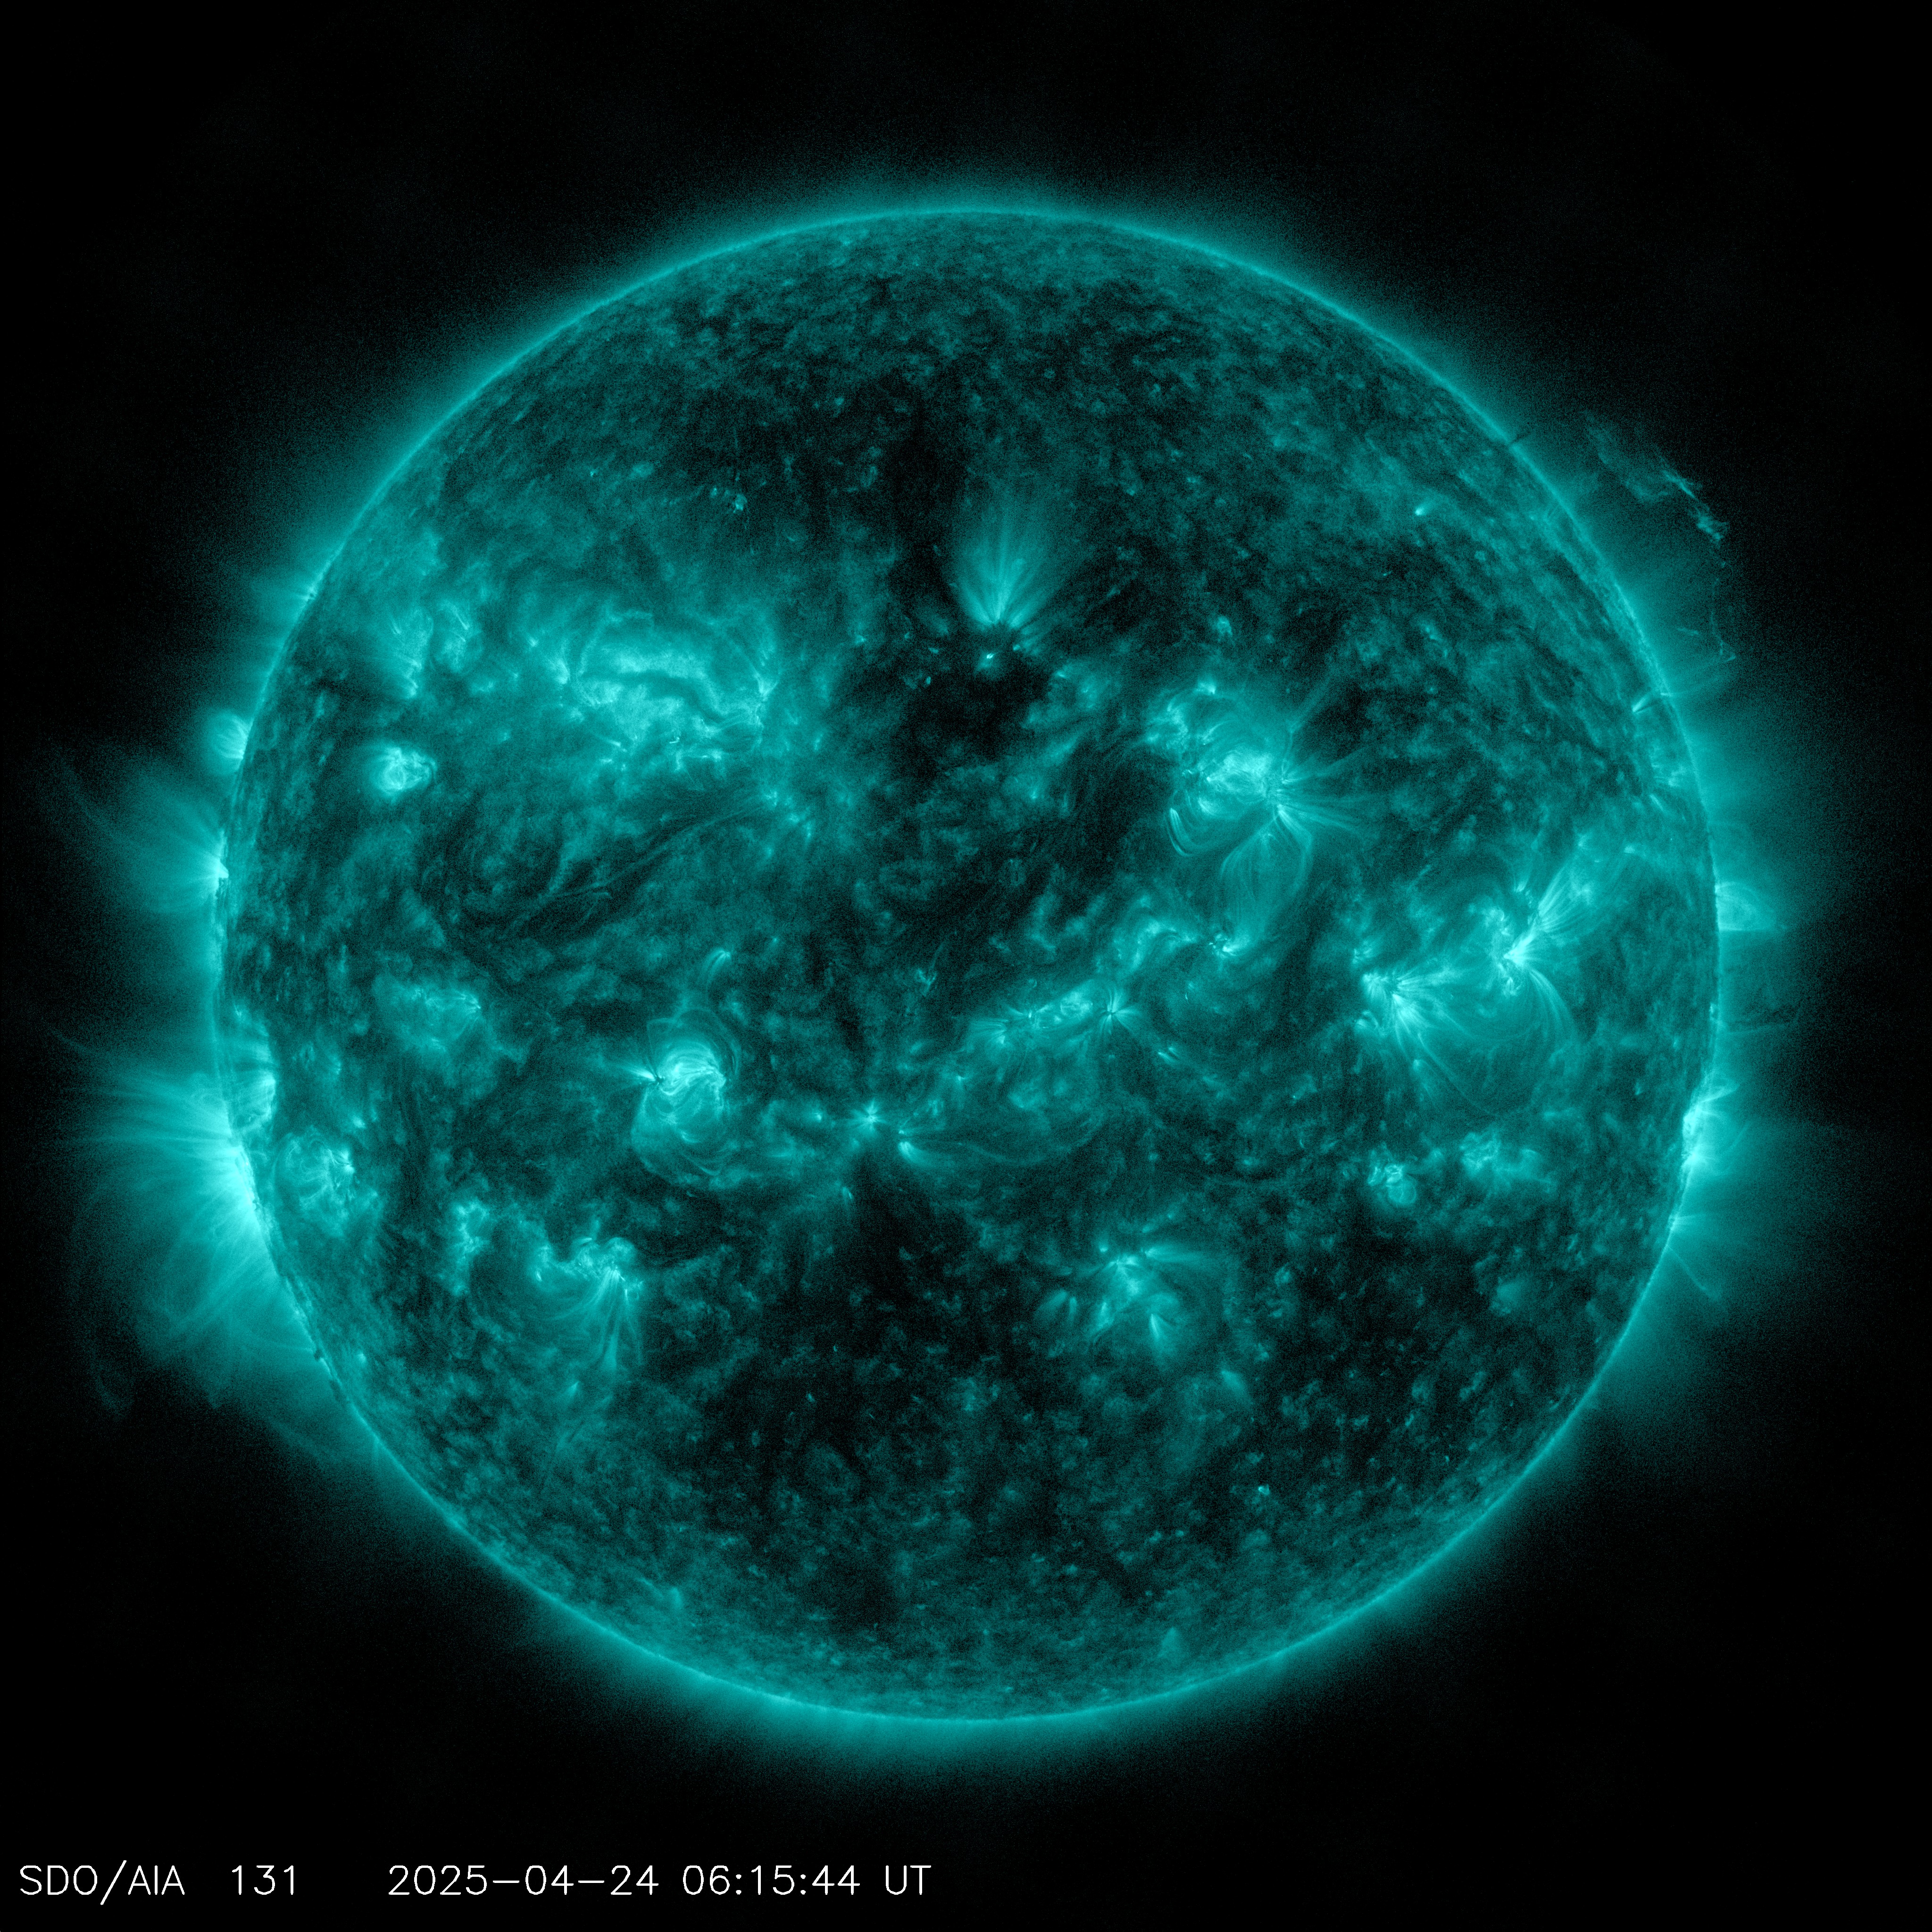
SDO / AIA 131Å = 13.1nm
optimal for solar flares
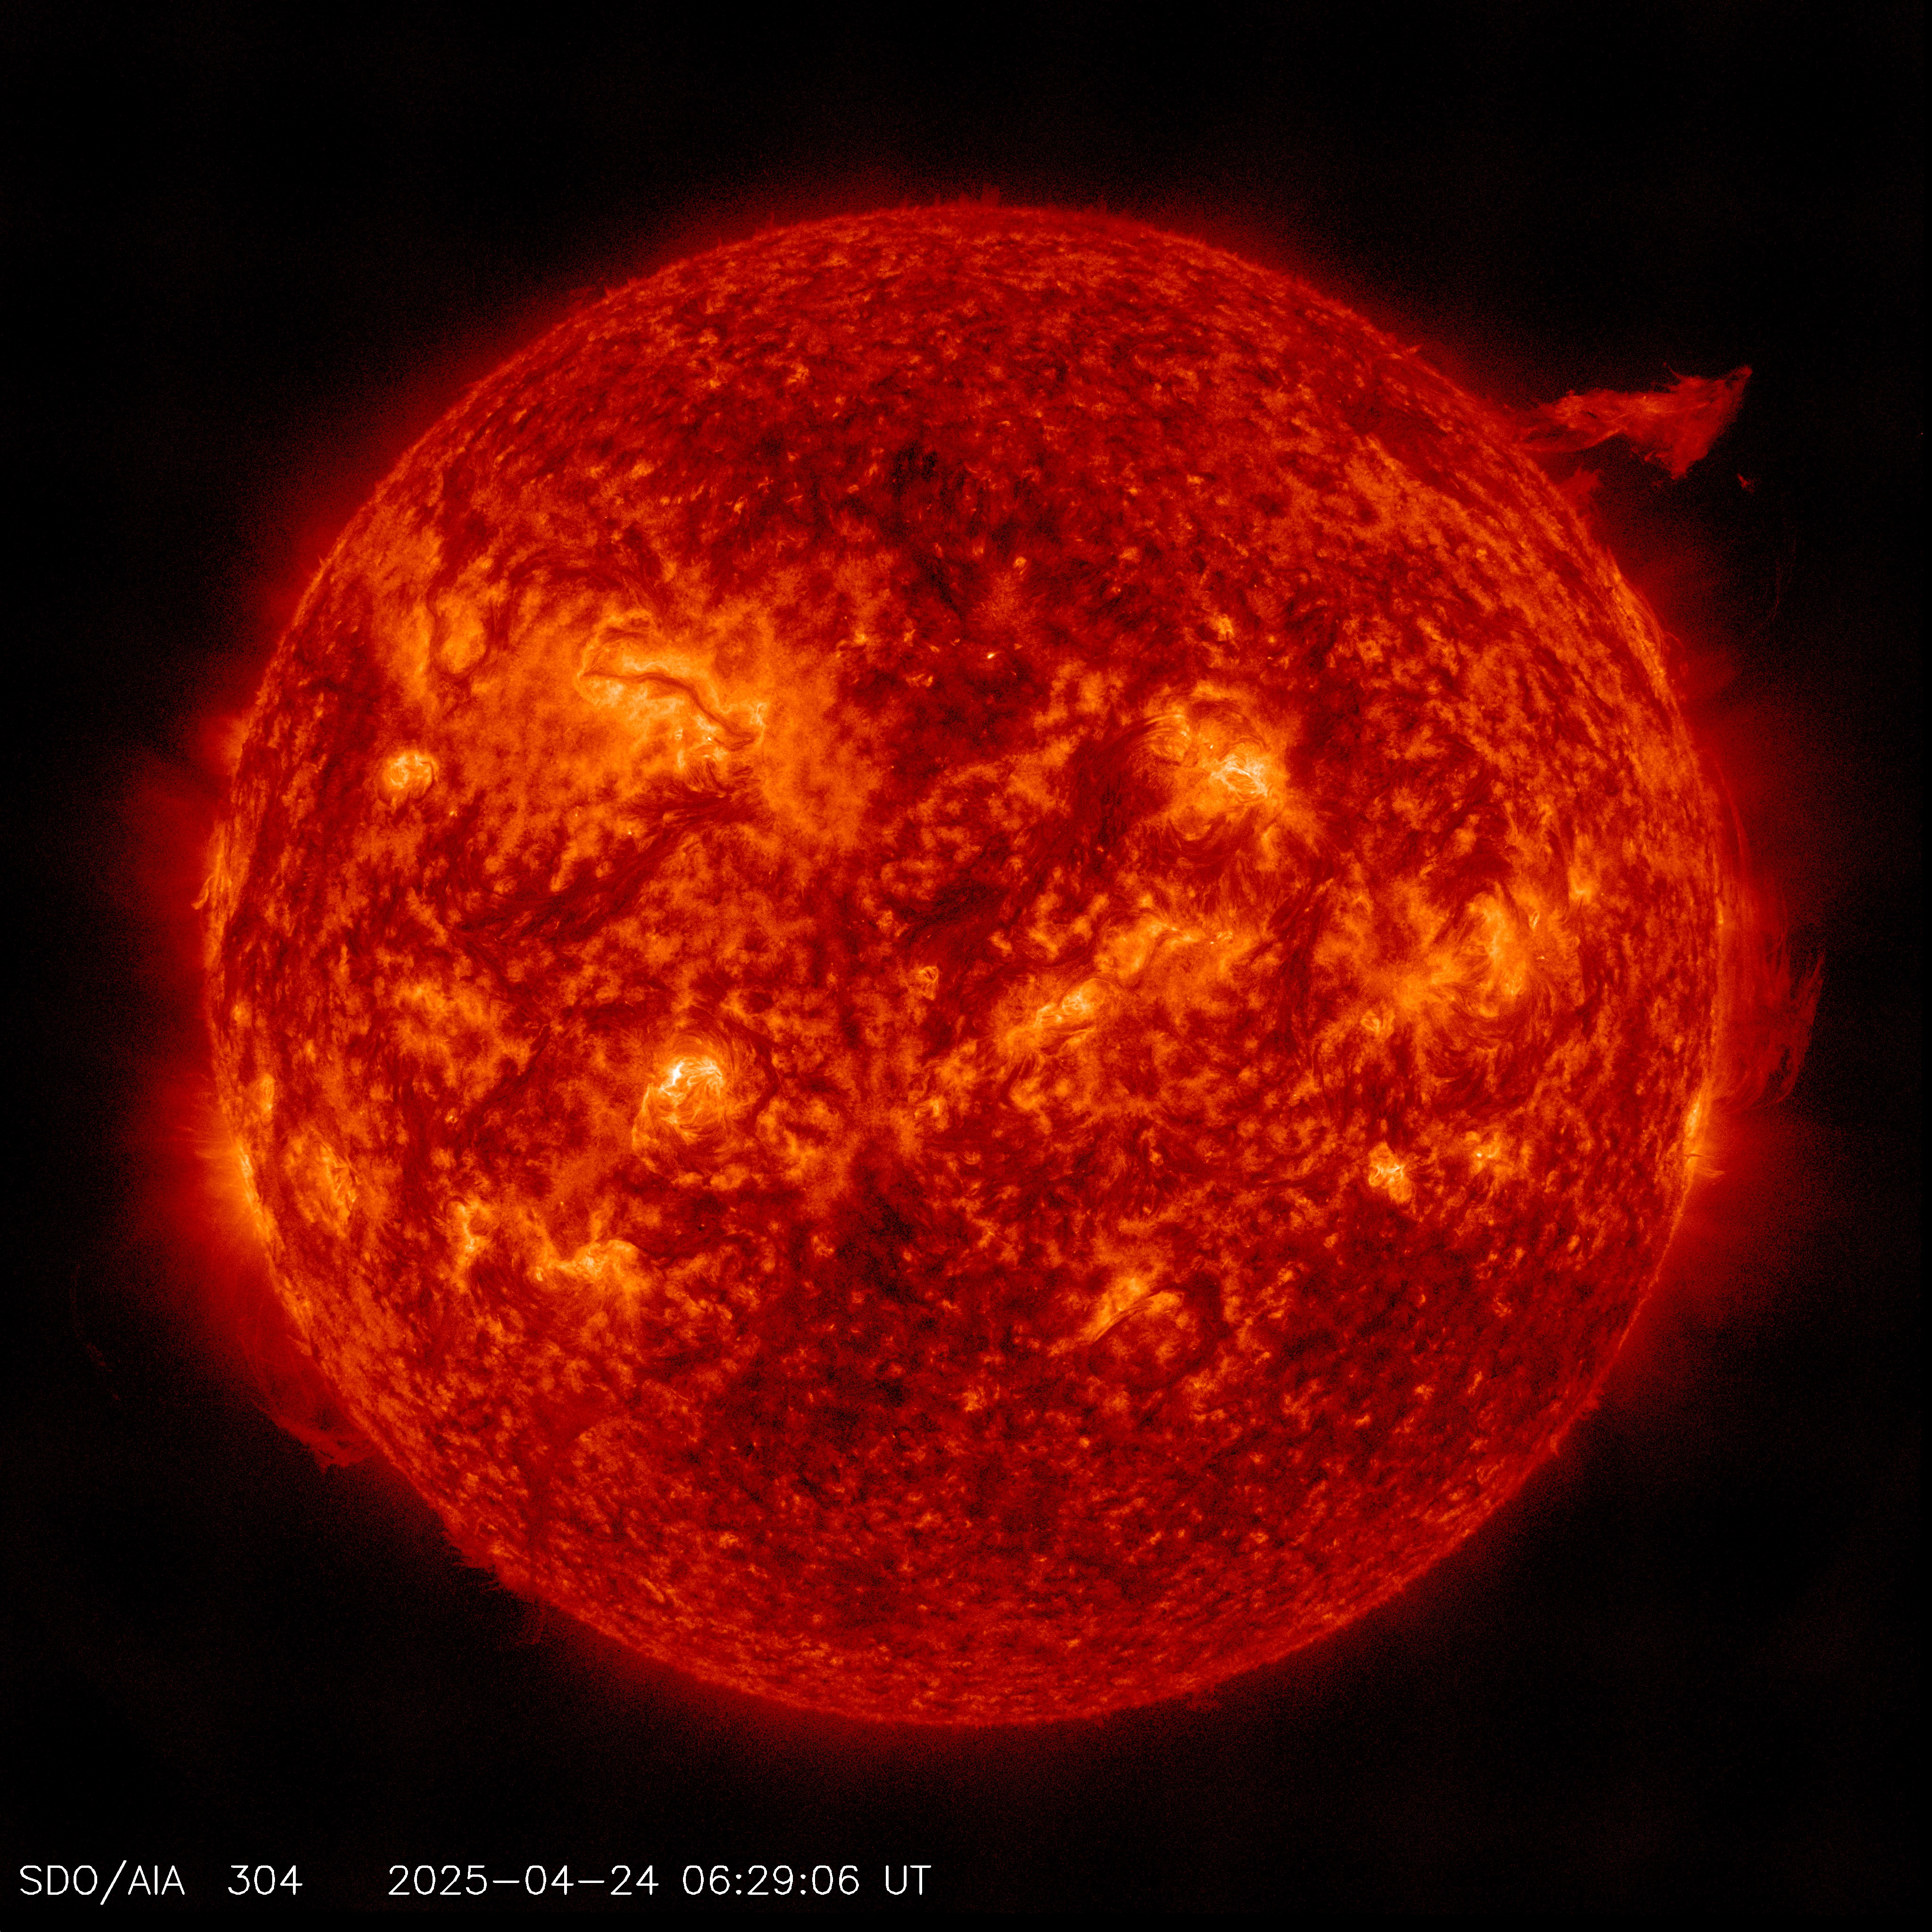
SDO / AIA 304 Å = 30.4nm
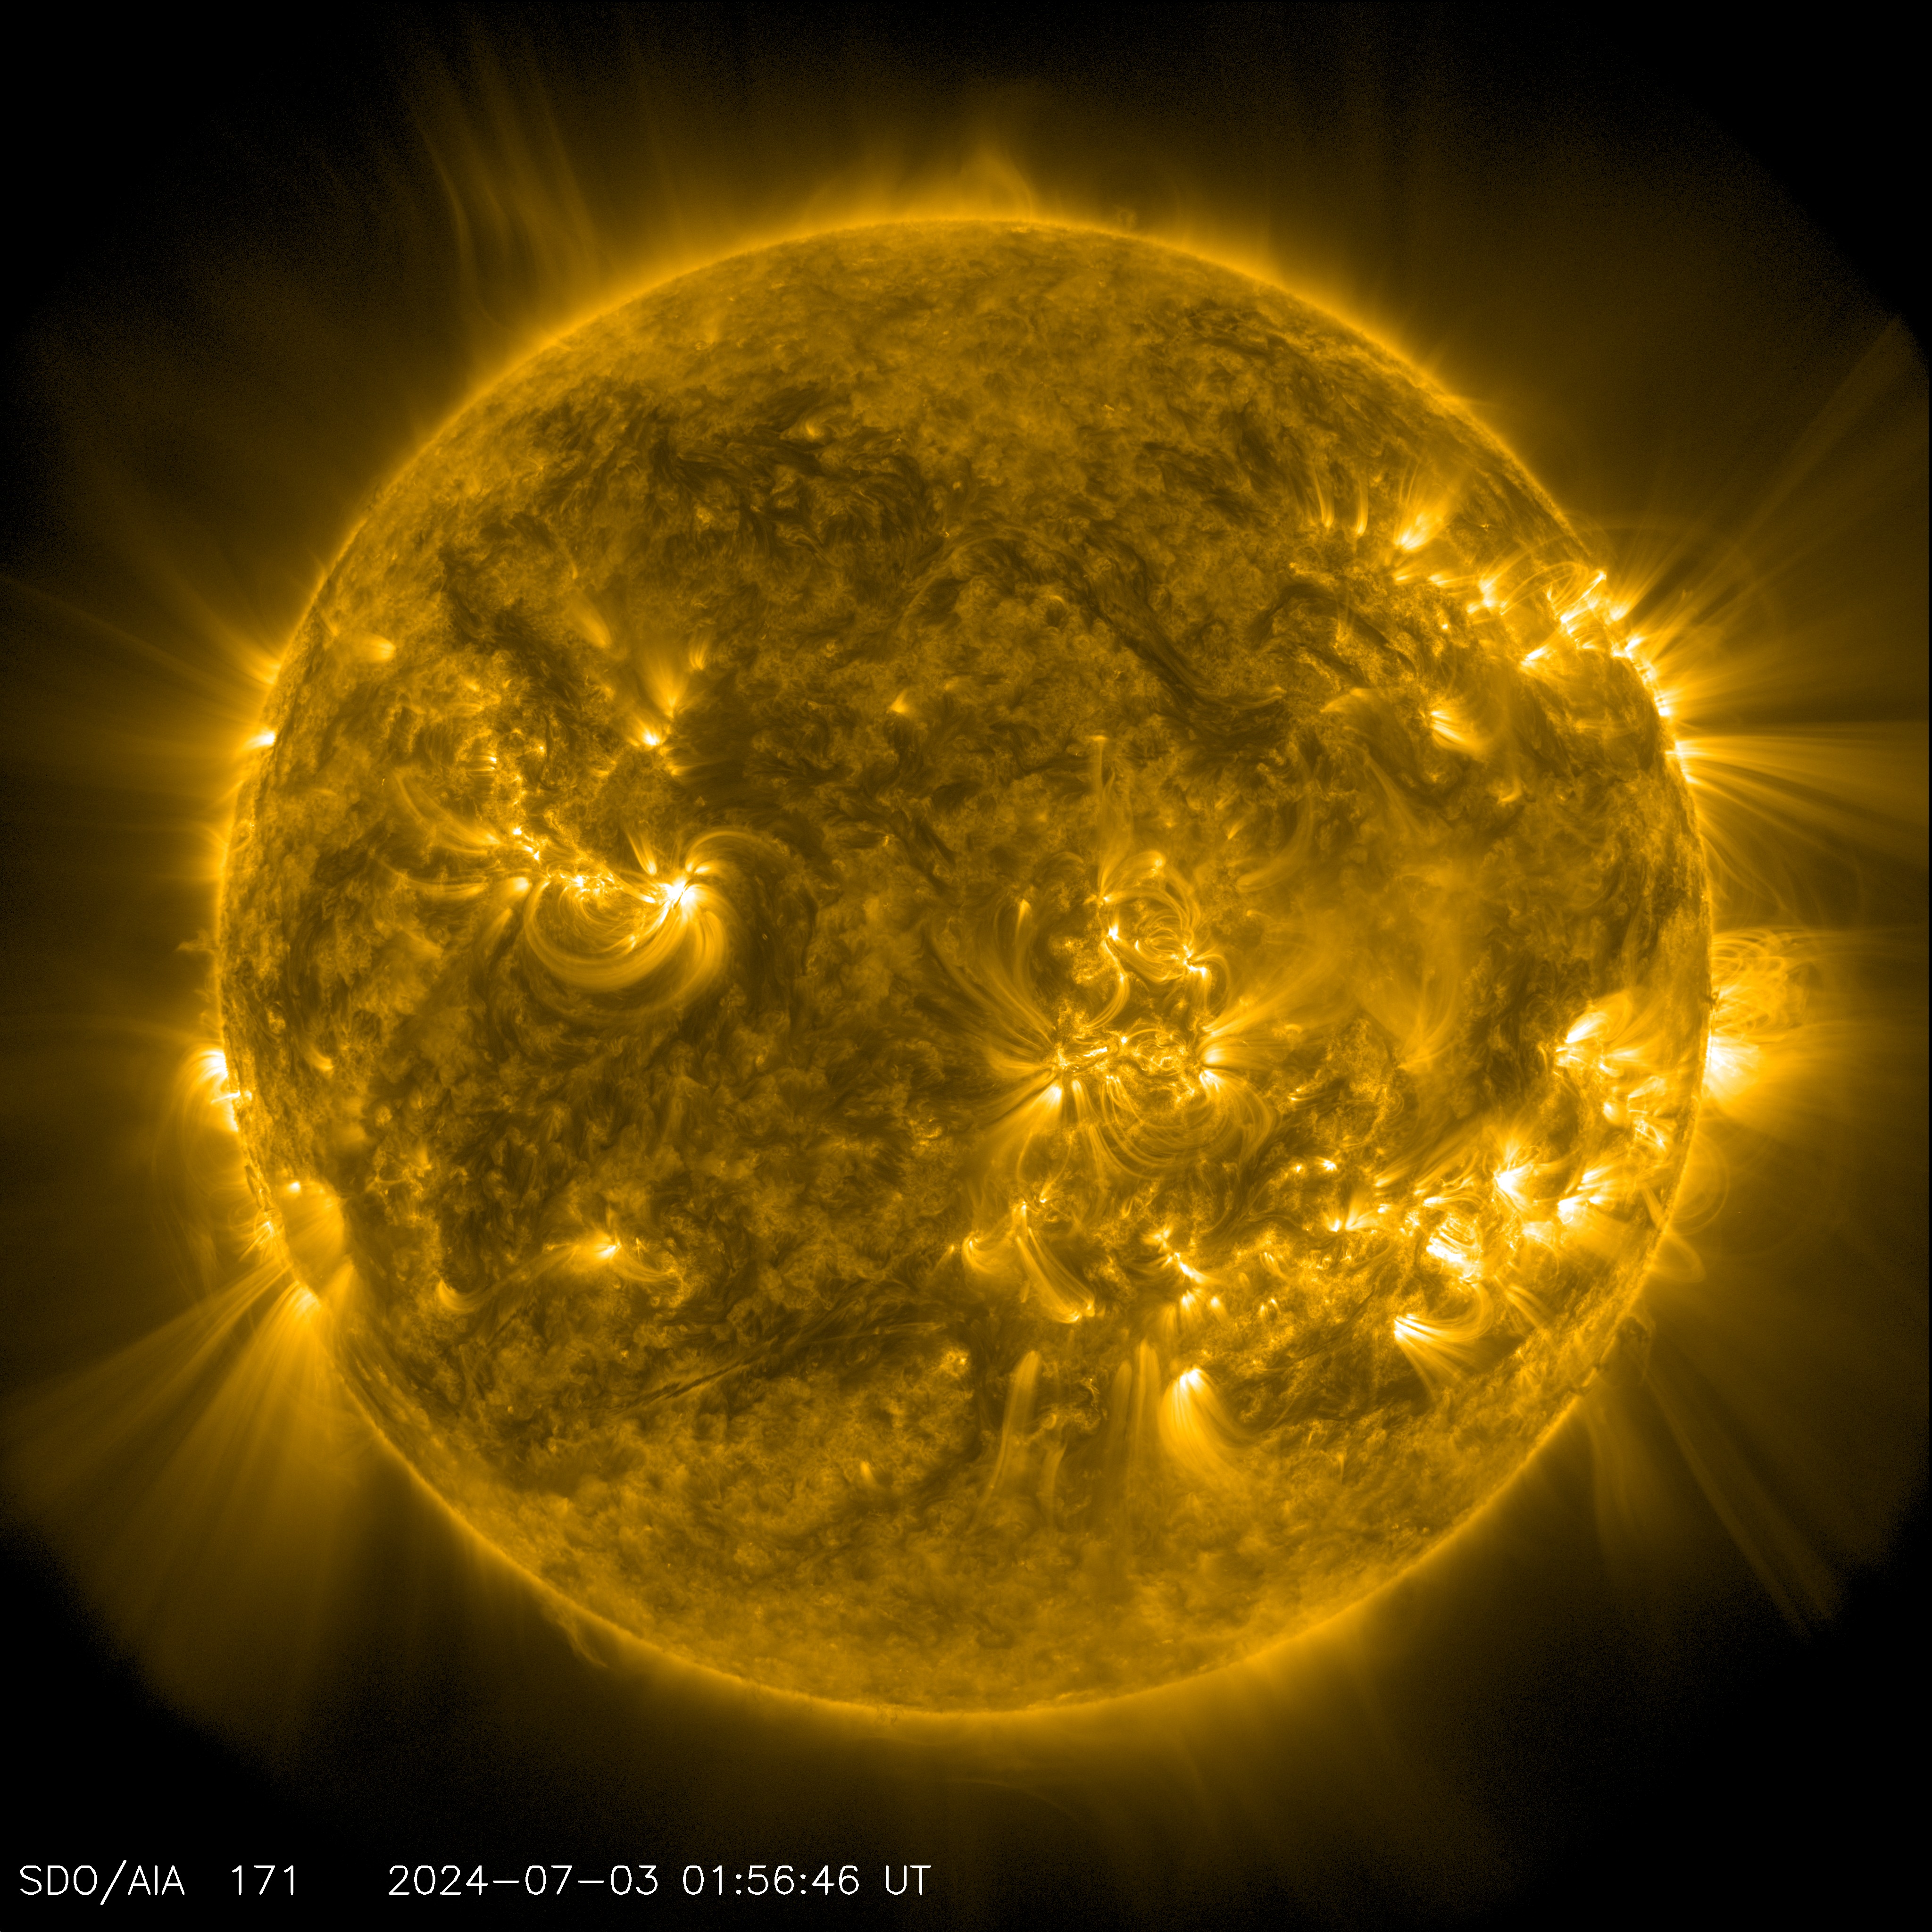
SDO / AIA 171 Å = 17.1nm
Showing coronal loops - the arcs extending off of the Sun where plasma moves along magnetic field lines. The brightest spots seen here are locations where the magnetic field near the surface is exceptionally strong.
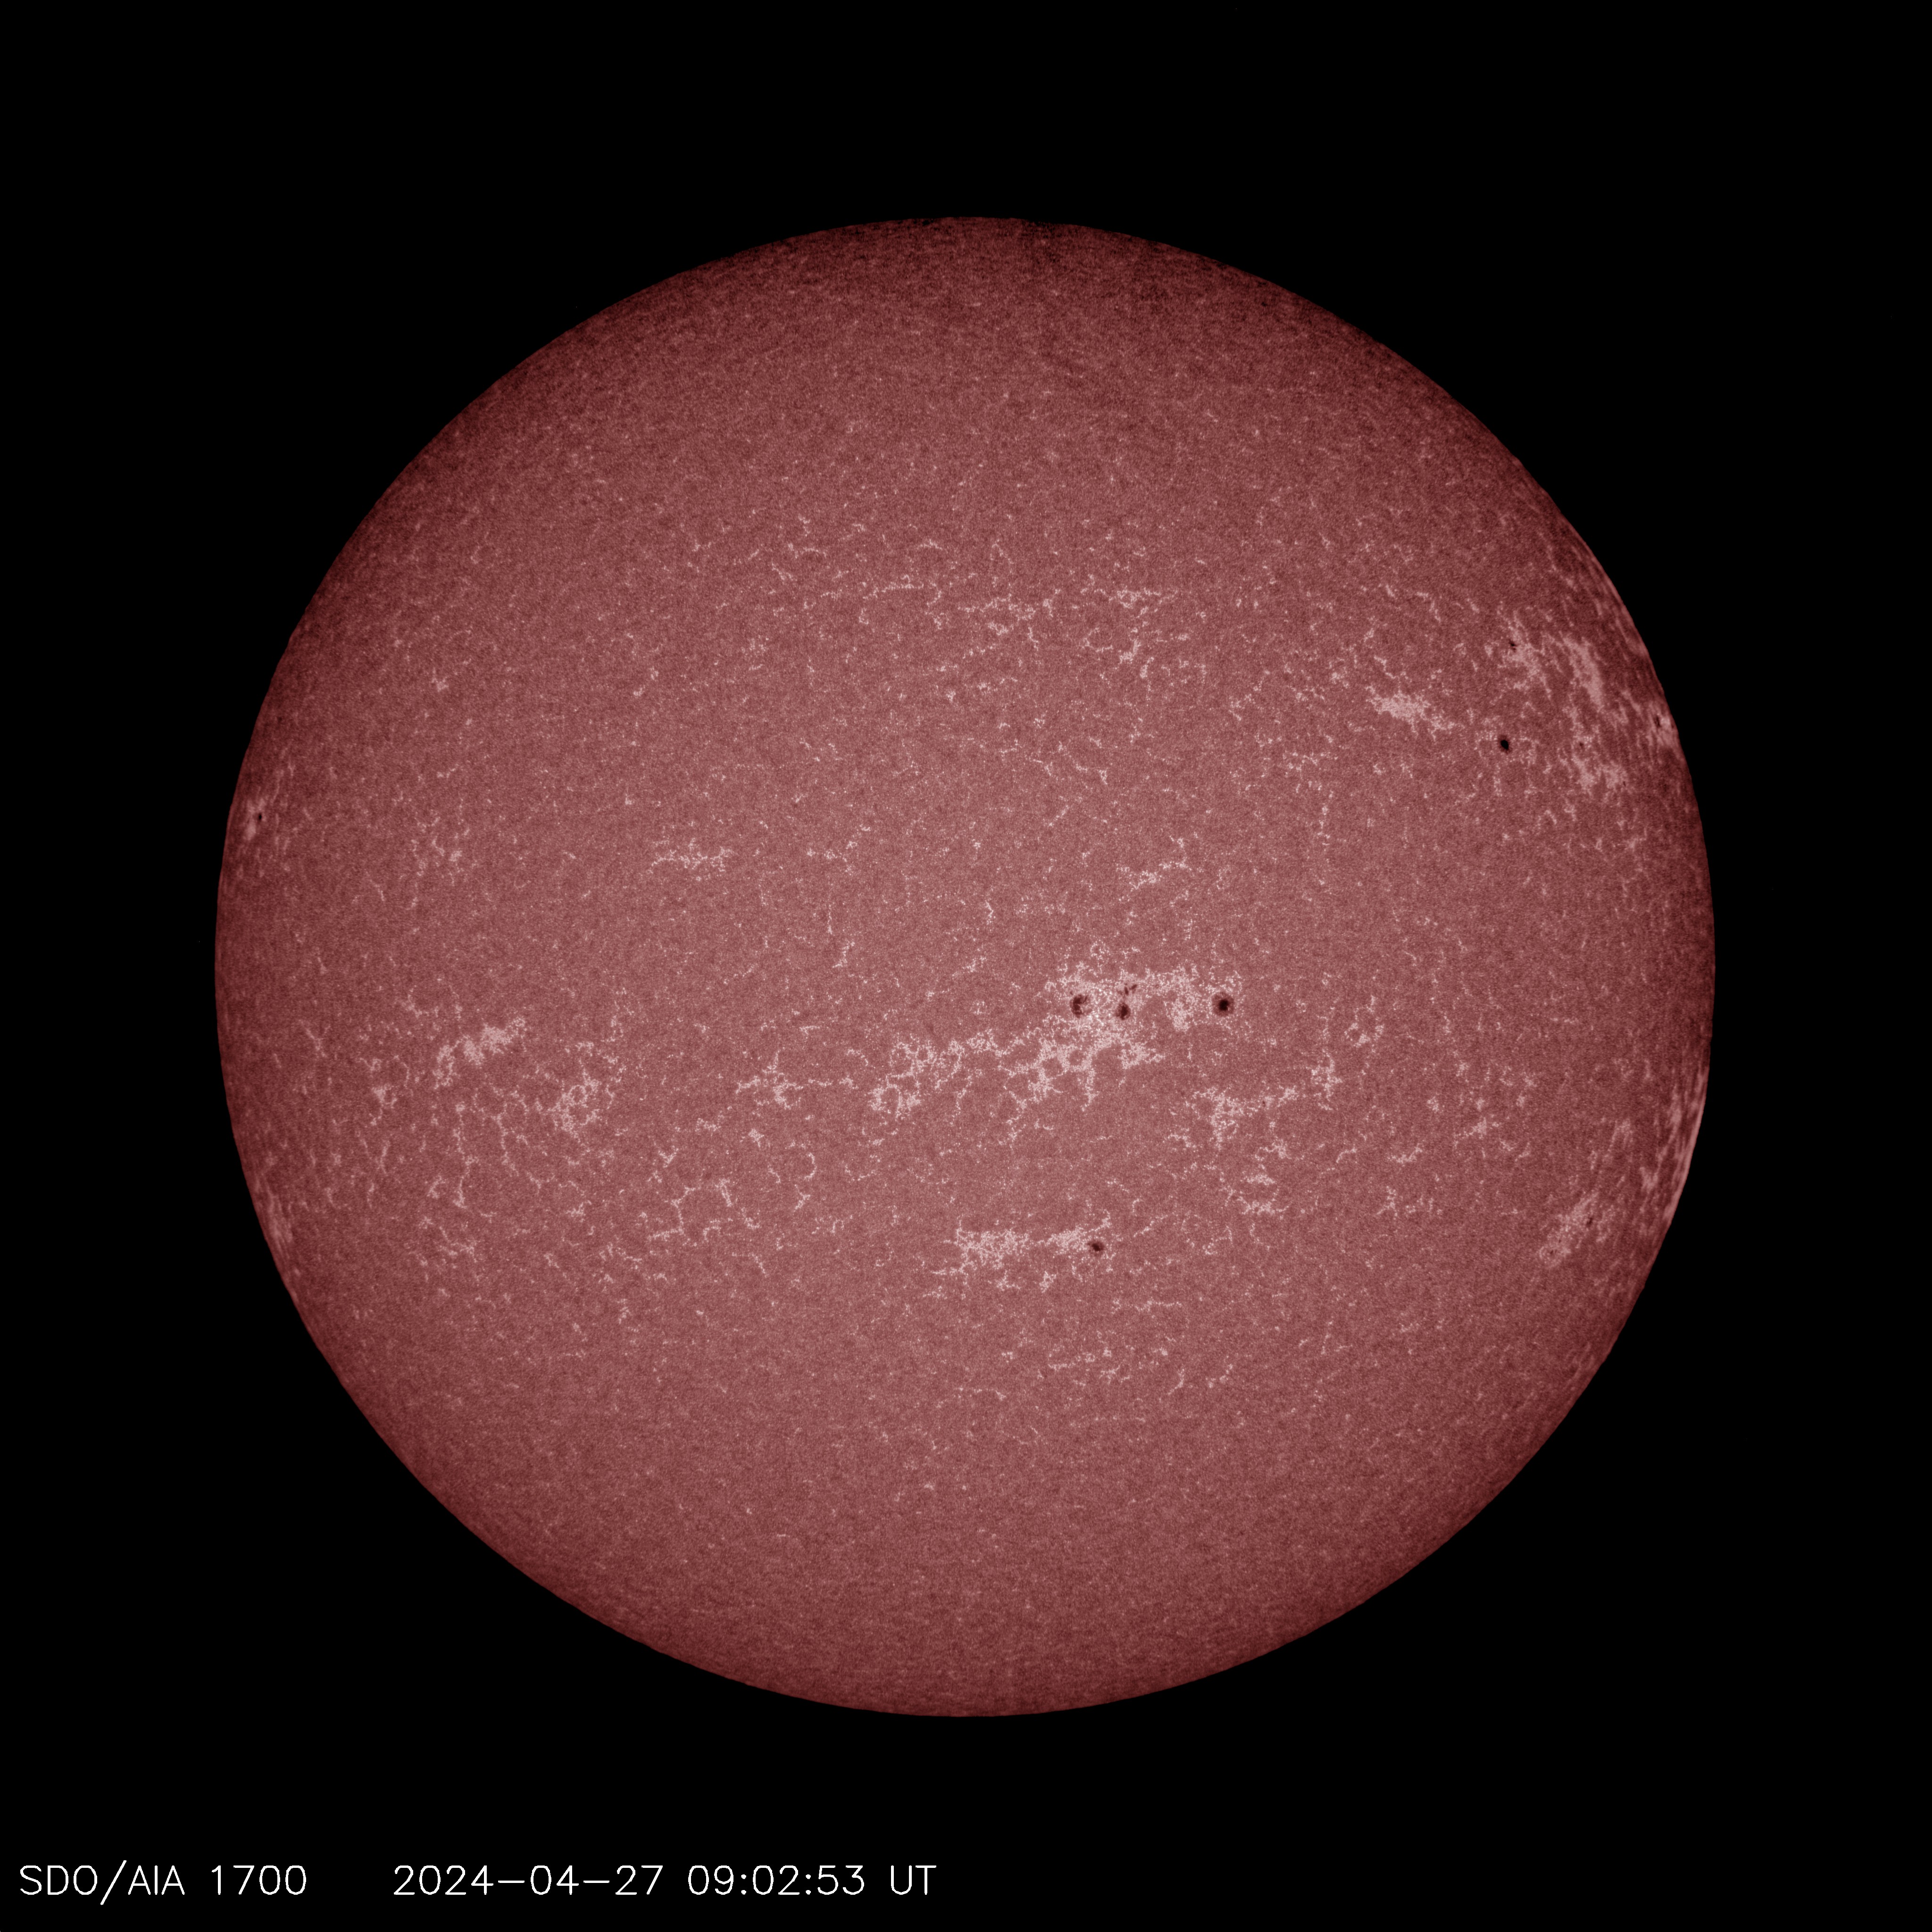
SDO / AIA 1700Å = 170nm
Far UV - small areas with a lot of field lines will appear black, usually near sunspots and active regions.
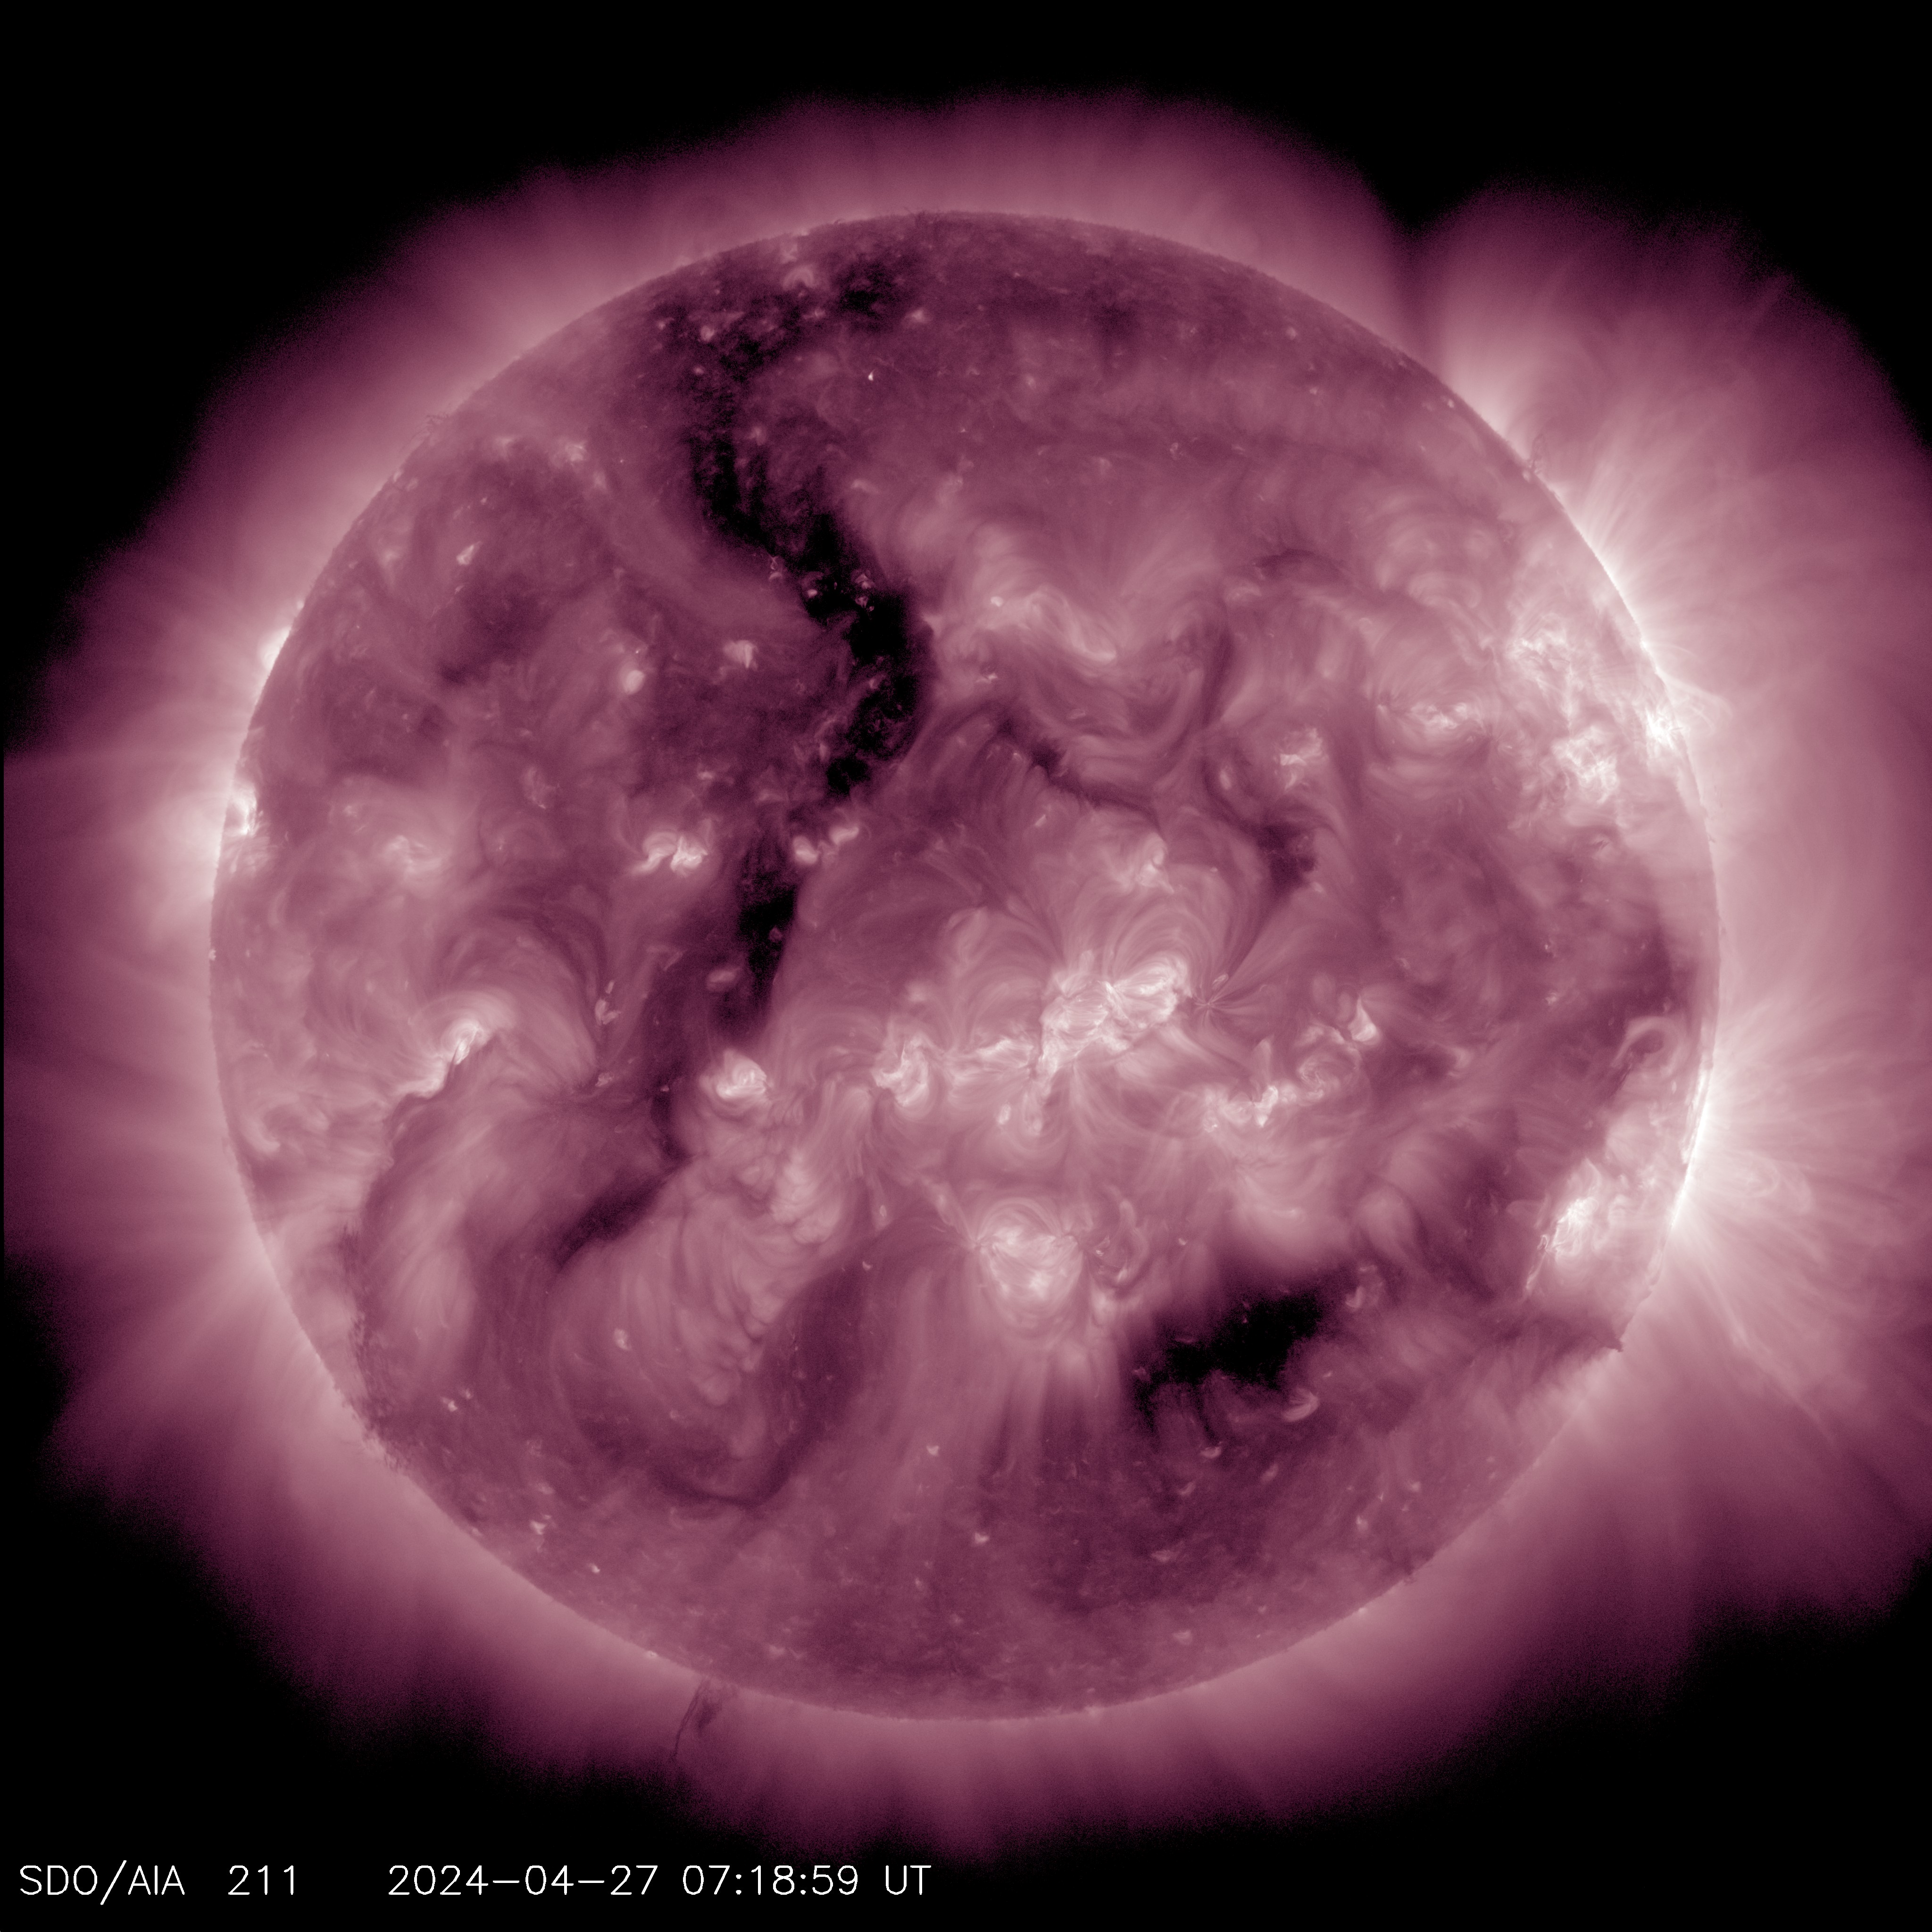
SDO / AIA 211Å = 21.1nm
Active regions, solar flares, and coronal mass ejections will appear bright here. The dark areas called coronal holes.
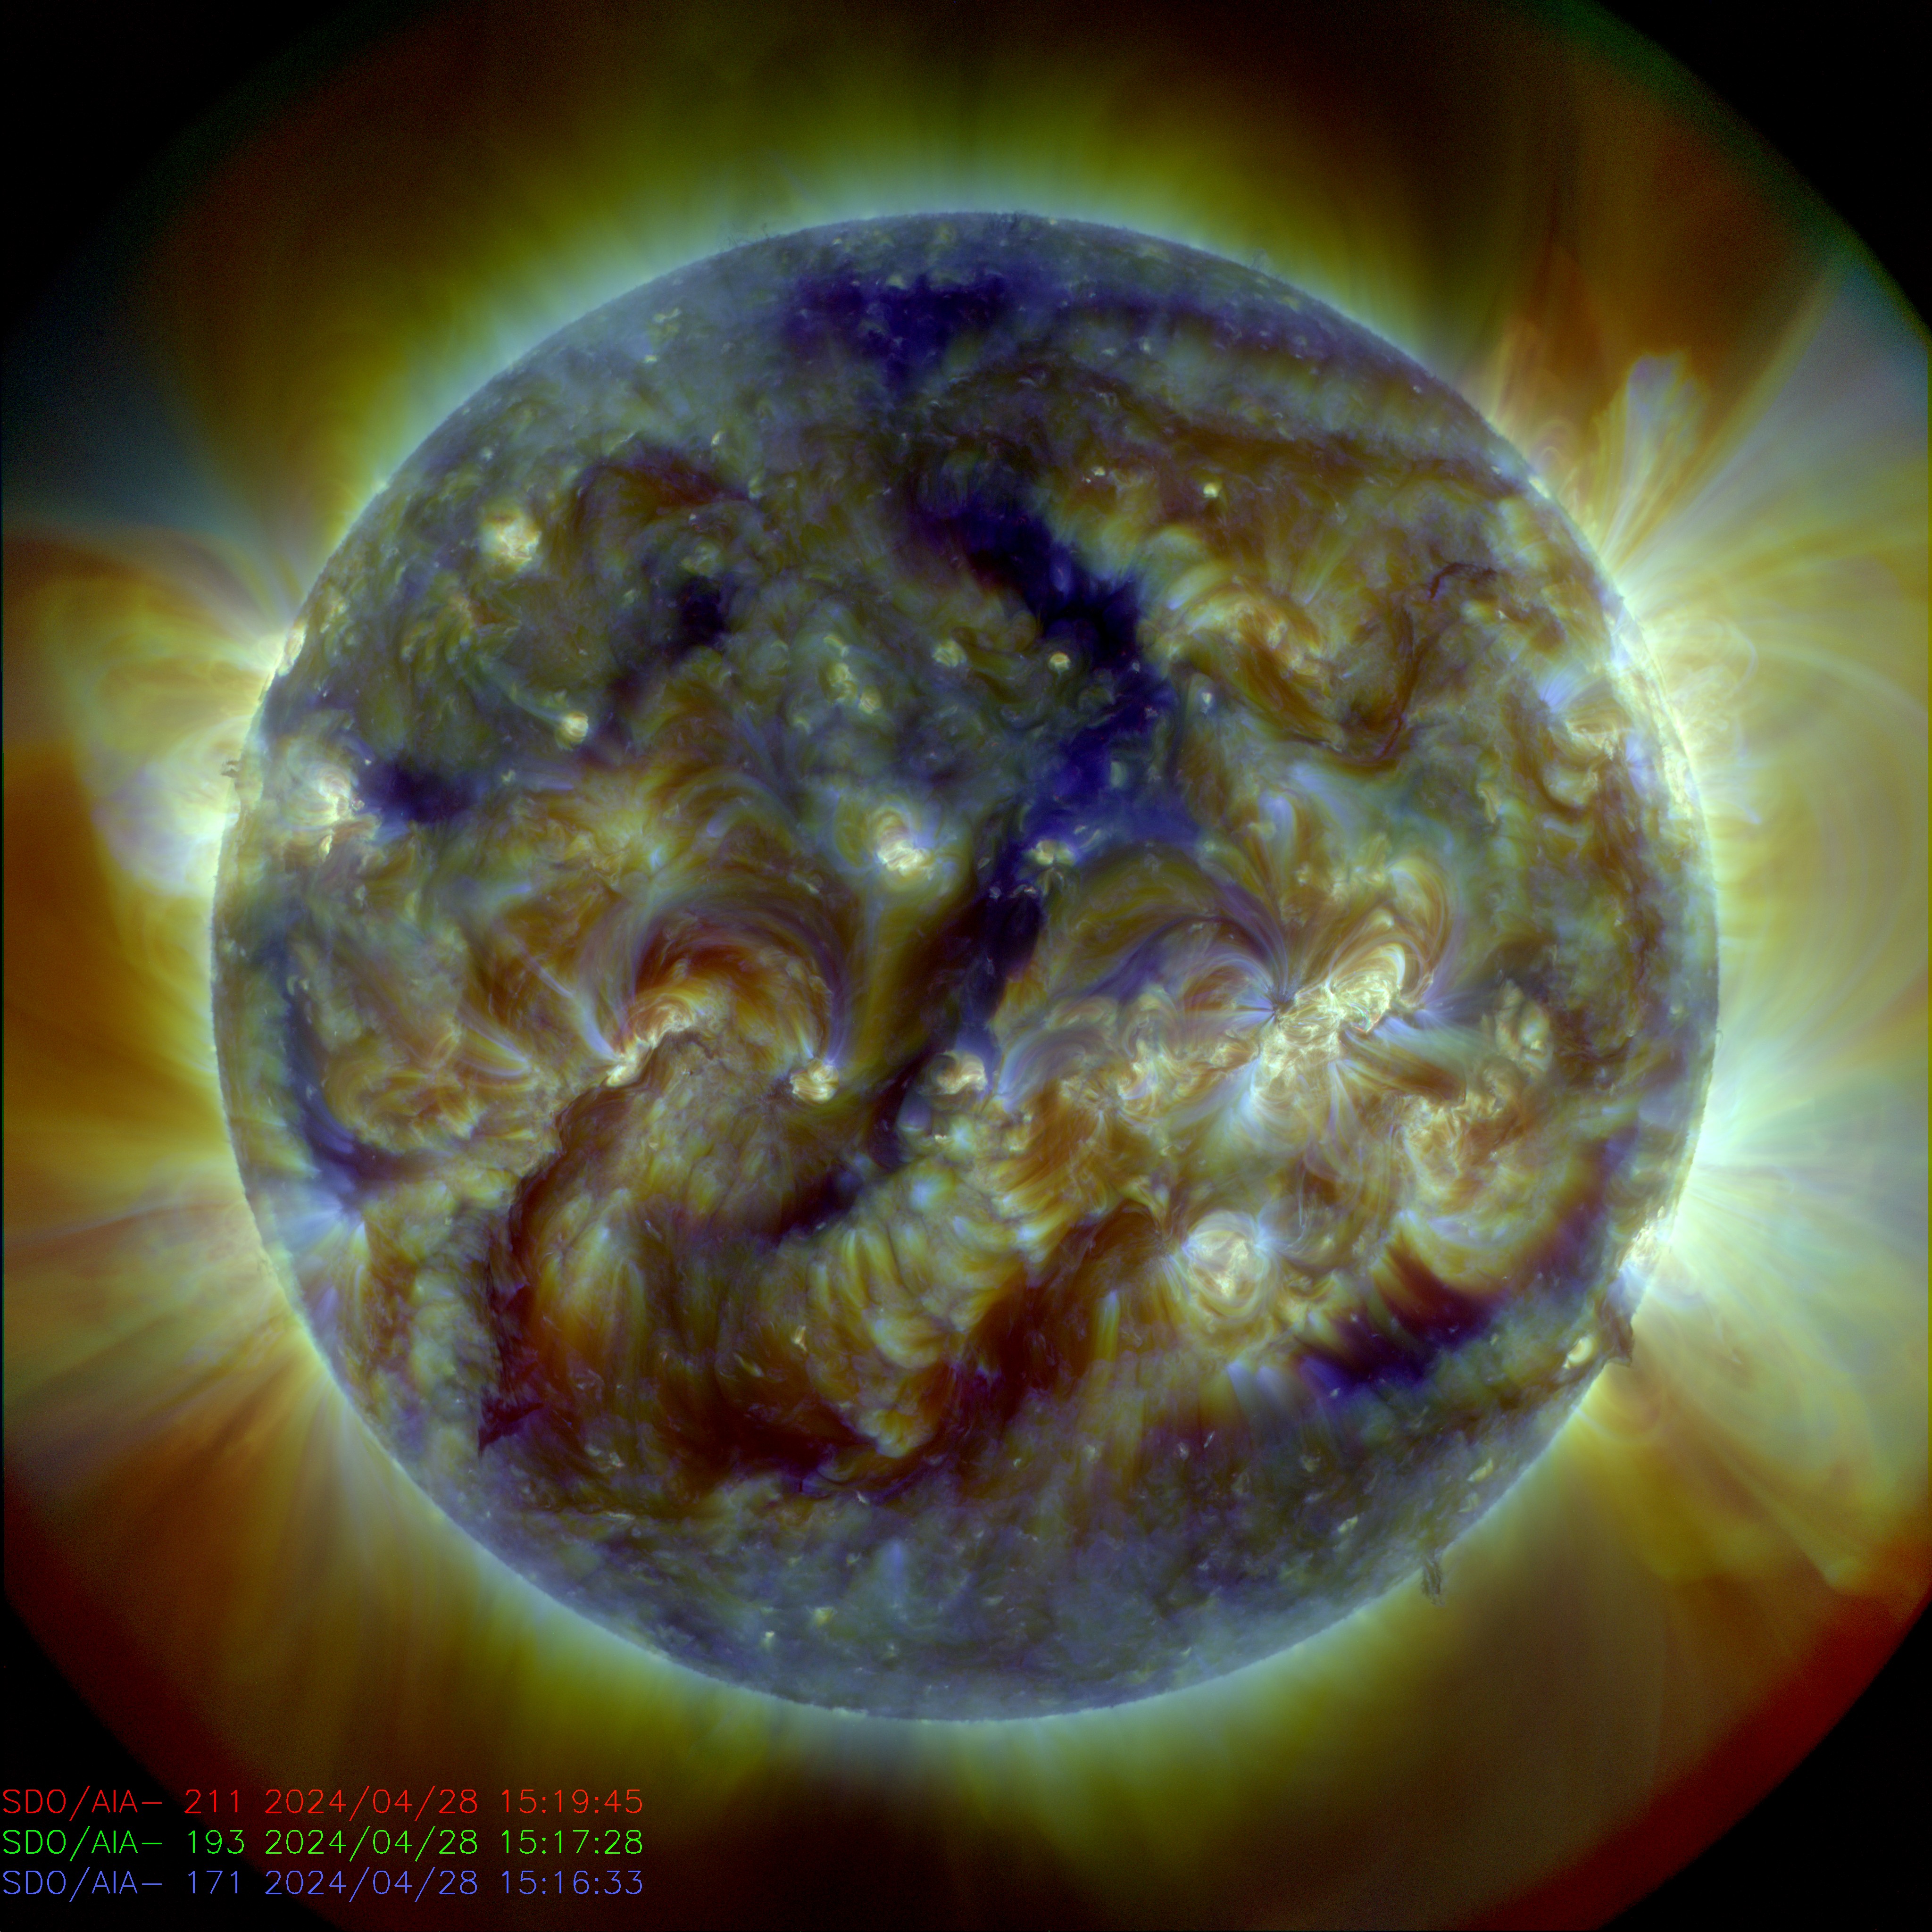
SDO / AIA 211 Å, 193 Å, 171 Å
Different parts of corona

HMI Colorized Magnetogram
Field strengths <24 G are shades of gray. Positive Field Values are green and blue. Negative field values are yellow and red. Weak field regions appear mostly yellow or green. Increasingly positive values range from dark green to bright green at 236G. Negative values move from bright yellow to orange at -236G.
All sun pics by courtesy of NASA/SDO and the AIA, EVE, and HMI science teams.
HMI and AIA Spectral Bands
| Band | FWHM (Δλ, Å) | Primary role, ion(s) | Region of the Sun's atmosphere | Typical Temperature (as log T[K]) |
|---|---|---|---|---|
| 6173 Å | 75 mÅ | HMI scans Fe i 6173 | Intensity, velocity, and magnetic field of photosphere | 3.7 |
| 4500 Å | 500 | Continuum | Photosphere | 3.7 |
| 1700 Å | 200 | Continumm | Temperature minimum, photosphere | 3.7 |
| 304 Å | 12.7 | He ii | Chromosphere, transition region | 4.7 |
| 1600 Å | 200 | C iv, continumm | Transition region, upper photosphere | 5.0 |
| 171 Å | 4.7 | Fe ix | Quiet corona, upper transition region | 5.8 |
| 193 Å | 6.0 | Fe xii, xxiv | Corona and hot flare plasma | 6.1, 7.3 |
| 211 Å | 7.0 | Fe xiv | Active region corona | 6.3 |
| 335 Å | 16.5 | Fe xvi | Active region corona | 6.4 |
| 94 Å | 0.9 | Fe xviii | Flaring regions | 6.8 |
| 131 Å | 4.4 | Fe xx, xxiii | Flaring regions | 7.0, 7.2 |